This article explains the elproCLOUD Dashboard and List View functions.
Last Updated: October 13, 2022
| Table of Content |
The dashboard provides you with a good overview on the status of all your sensors. Each sensor is represented by a separate tile.
With update to elproCLOUD version 2.0, you will find a new filter for "Sensor Groups" in your dashboard. Please go to the chapter Sensor Groups for more information.

Dashboard Overview
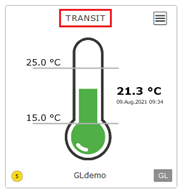
For each sensor you can see
-
the latest measurement value and date
-
configured alarm limits
-
the sensor's name
- the signal strength at the last connection

-
Furthermore, the sensor's alarm status is visualized. The background color indicates whether there is an active alarm or warning for the corresponding sensor:

-
Colored icons in the top part indicate whether there are unacknowledged alarms or warnings for the corresponding sensor:

-
If all alarms or warnings, respectively, have been acknowledged, but there are still active incidents, this is indicated by the following icons in grey:

-
By clicking on this Icon
 , you will open the sensor menu.
List view
The device list view provides a better overview, especially with many sensors, and features various sorting and filtering options.

By clicking on this Icon ![]() , you will open the sensor menu.
, you will open the sensor menu.
The following columns are available:
- Device Name (optional name of the sensor, by default serial number and channel number)
- Module ID (corresponds to the serial number)
- Channel ID (Channel 1 or 2)
- Customer ID (optional, by default the module ID)
- State (Same alarm and warning status and colors as in the dashboard)
- Measurement Date
- Measurement Value
- Device State
- Start Date
- Run Number
- Device Family Type
- Device Type
- Metadata 2
- Metadata 3
- Metadata 4
- Metadata 5
- Metadata 6
- Metadata 7
- Metadata 8
It is possible to customize the order and width of the columns via drag & drop, simply select a column with your mouse or finger and move the column. Clicking on one of the column headers will sort the list accordingly. You can also select the columns to be displayed under "Columns" on the right side or group the view according to column data.
In addition, filtering options are available to screen the view by any of the information from the columns. The filters can also be found on the right side.
With a right click on the list you can export the list data as CSV or XLSX file.
Once the list view is completely set up according to your needs, you can save the view for future logins:

Sensor Menu
The sensor menu can be accessed from the Dashboard by clicking on the icon located in the upper right corner of the tile representing the corresponding sensor:

The sensor menu offers the following, sensor-related functions:
-
Analyse: Open the sensor analysis view
- Summary: Open the sensor configuration summary page
-
Deactivate alarming / Activate alarming: Switch alarming off/on
-
Configuration: Open the sensor configuration wizard
-
Replace sensor: Replace the module with another, e.g. with a newly calibrated, sensor module. For more information about the replacement process, please visit this page.
-
Manage license: Open the license overview page
-
Delete: Delete the sensor including all data
Why is my sensor blurred out?
From the first day after the license expires without renewal, the readings of this sensor in the dashboard will be blurred out and the alert will be disabled (see picture below). However, the recording will continue. Please find more information on your license renewal on this page.

What are the LIBERO Gx device states?
For LIBERO Gx, the dashboard displays the different device states:

CONFIG PENDING: device is no longer in shelf life, waiting for its configuration.
START: depending on the activation mode, the device will enter into DELAY or TRANSIT.
DELAY: device successfully configured with a configured starting delay.
TRANSIT: device and measurement started, alarming activated.
ARRIVED: Pressing the “Stop” button for devices in transit the first time, the device will enter arrived mode. The run icon on the display disappears. The device will still log and communicate (interval 2 hours) for 72 hours or until stopped.
STOPPED: After pressing the “Stop” button for the second time, the device is stopped. In stop mode, the device will not log measurement data. The device communicates at a reduced interval (12 hours) for 24 hours.
CONFIG ERROR: configuration not successfully transmitted.
Please find more details on LIBERO Gx device states here.
